Explanation of the simulations
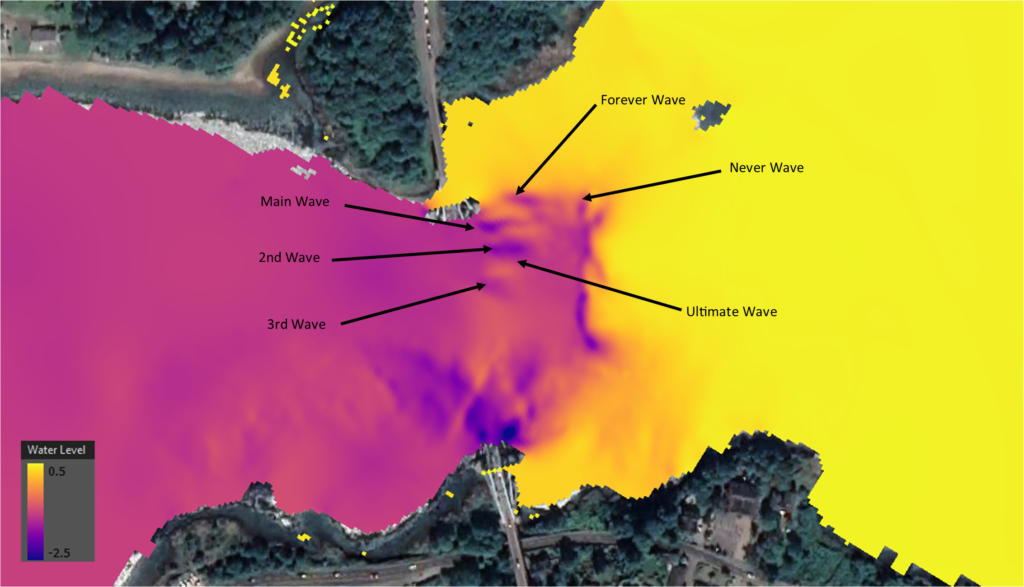
The simulation results shown in the figures and videos of the Falls of Lora and Loch Etive is for the 20th – 23rd February 2023. It was developed using an 2D computational hydraulic modelling package called TUFLOW (https://www.tuflow.com) based on:
- A bathymetry digital terrain model (DTM) from the UK Admiralty Marine Data Portal (https://www.admiralty.co.uk/access-data/seabed-mapping).
- The Phase 1 Scottish Goverment LIDAR DTM from the Scottish remote sensing portal (https://remotesensingdata.gov.scot).
- Ordnance Survey (OS) Open Data Terrain® 50m DTM (https://osdatahub.os.uk/downloads/open/Terrain50).
The three separate DTM sources were used as the bathymetry does not extend above around the low water mark and the LIDAR and OS DTM’s do not extend below the high water mark and the LIDAR coverage was insufficient to cover all areas surrounding the loch.
Due to there being a small gap in the coverage of the DTM’s in the intertidal zone, an interpolated ‘fringe’ DTM was created by linearly interpolating levels along the edges of the adjacent DTM’s using QGIS (https://qgis.org/en/site/) . These 4 DTM’s were then overlaid within the hydraulic model to provide the bed levels for the model.
The calculations carried out by the hydraulic modelling package are based on a 2D square grid with water levels and velocities calculated within each of the 2D grid cells. This model used a variable grid size ranging from 2.5m to 20m. This allowed the model to represent narrow, shallow areas of the loch and the Falls of Lora at a higher resolution and where the loch was deep and wide, represent it at a lower resolution.
The boundary of the model at the downstream end applied a time varying water level based on the 15 minute SEPA gauge data (https://www2.sepa.org.uk/waterlevels/?sd=t&lc=490749) from the ‘Firth of Lorn@Oban’ tidal gauge. It is worth noting that as there is a slight difference in the timing and tide levels between Oban and Dunstaffnage there is a similar difference in timing and levels between the model results and reality.
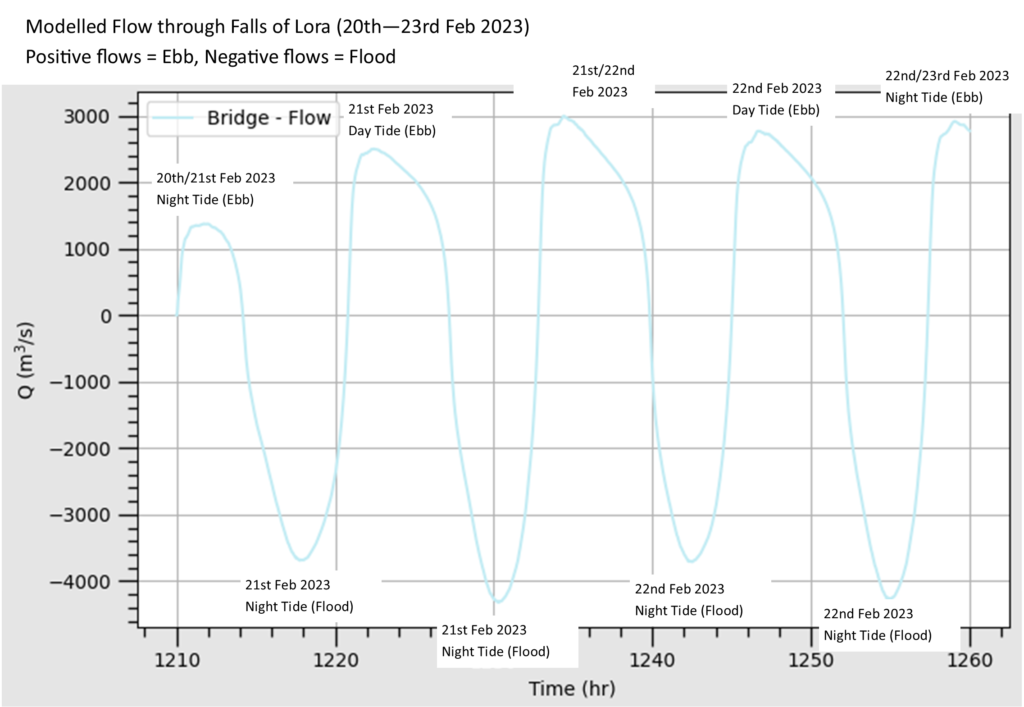
From the graph of modelled flow through the Falls of Lora the observant among you will notice that the peak flow during the flood tide (negative flow values) are around 4000m3/s whereas the peak flow during the ebb tide (positive flow values) are only around 3000m3/s. At first glance this may seem strange as if there were higher flows going into the loch that were coming out of the loch then the water level in the loch would keep rising. However, looking at it closer you will see that the duration of the highest flows during the flood tide occur for a shorter period of time than the highest flows during the ebb tide. This means that although the peak flow is higher during the flood, the total volume passing through the Falls of Lora is equal in both directions.
It is worth noting that this model does not account for inflows into Loch Etive from the rivers that flow into the loch as these under normal flow conditions likely represent less than 2% (60m3/s) of the peak ebb flows resulting from the tides alone.
Those of you who have been to the falls after prolonged periods of heavy rain will maybe have noticed that the falls feels bigger. Given the catchment area draining to the falls of lora is approximately 1340km2, it is easily possible for flows in excess of 300m3/s (10% of the ebb tide peak flow) to be flowing into the loch during periods of prolonged heavy rainfall. This means that over the course of a full tidal cycle (assuming a constant 300m3/s inflow) it is plausible that there is more than 20% more flow (10% from the period when the tide flooding and 10% from when the tide is ebbing) leaving the loch during the peak of the ebb.
I hope this has been of interest to some. There is a huge amount more technical detail I could discuss about this model, many other scenarios that I would like to look at including river inflows, and look into the effects of wind and pressure, the impacts that climate change may have on the Falls of Lora and even develop a forecast that could further enhance the level of reliability of Tony’s predictions by accounting for prevailing weather conditions.
I may at some point write a full paper discussing the intricacies of it all (which I will of course share) however until then feel free to ask me any questions you have about it (either in person or on social media) and I will do my best to answer them.
If you are interested in how I know how to carry out this sort hydraulic modelling, I have worked as a flood risk consultant/engineer since 2016 and this sort of computational hydraulic modelling is a key part of how I assess flood risk to properties, infrastructure, people, land etc. and advise on how to mitigate or reduce that risk. My job involves a lot of hydrology, fluid mechanics, civil engineering, data science, coding, GIS and of course building models like this. It is a sector with an ever growing demand as a result of increased flood risk due to the effects of climate change and if you would be interested in learning more about the type of work I do, please feel free to get in touch.
Calum Peden

